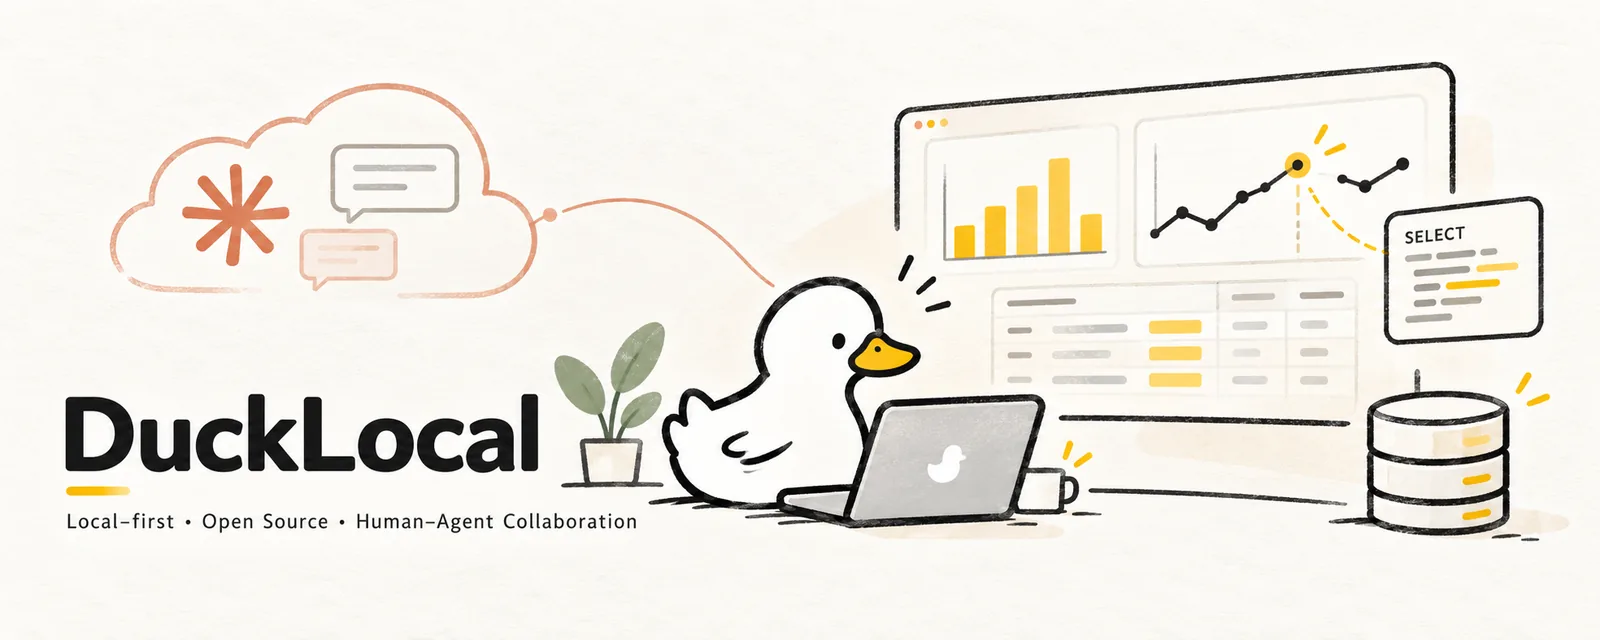
 DuckLocal
On October 8, Anthropic released Claude Dashboards. Connect a data source, describe what you need in natural language, and Claude can write the SQL, build visualizations, and create a dashboard that continues to update.
My first reaction was: this overlaps with several ideas I have been exploring in DuckLocal.
DuckLocal is a local-first desktop data tool I am building with DuckDB and GPUI. Beyond querying and exploring files, I have been working on declarative dashboards that let AI agents participate in analysis and visualization.
Claude Dashboards was therefore more than an interesting product release. It made me reconsider where DuckLocal should go next.
1. What does Claude Dashboards do?
Building a dashboard traditionally means connecting a database, understanding its schema, writing SQL, choosing charts and metrics, configuring filters, arranging the layout, and publishing the result. None of those steps is especially unusual for an analyst, but together they remain a substantial barrier for everyone else.
Claude Dashboards brings those steps into a natural-language interaction. A user might ask:
Analyze our revenue trend over the last six months, break it down by region, and show me the fastest-growing part of the business.
Claude can generate the queries and charts from connected data. It supports platforms such as Snowflake, BigQuery, Redshift, Databricks, and ClickHouse, and connectors can bring in data from business systems such as Salesforce.
Two design choices stood out to me.
A dashboard becomes an analysis object that keeps evolving
The dashboard is not merely a final presentation. A user can keep asking Claude to change a chart, add a filter, or investigate another dimension without rebuilding the dashboard by hand.
The SQL behind each chart remains visible
Users can inspect not only the result but also how it was calculated. AI can lower the barrier to analysis, but it should not turn the analysis into an uninspectable black box.
2. What does Claude Dashboards validate?
I have held one idea throughout the development of DuckLocal:
A dashboard should not be a static page at the end of a BI workflow. It should be a workspace where people and AI agents analyze data together.
Traditional BI usually has an analyst create a dashboard and hand it to business users. When somebody questions a metric, they go back to the analyst, who updates the SQL or adds another chart.
An AI agent can change that loop. A person asks a question; the agent explores the data and creates a dashboard. When the person notices something unexpected, they ask the agent to adjust the query or investigate further.
The dashboard shifts from one-way reporting toward two-way analytical interaction. Claude Dashboards made me more confident that this direction is worth exploring.
A large company entering a space does not prove commercial demand on its own. It does show that natural-language analysis, SQL, and dashboards have become an active area of investment for AI products. Users may not need more charts so much as a faster path to trustworthy answers.
3. Two lessons I took from Claude Dashboards
DuckLocal v0.2.1 introduces two capabilities related to this direction.
Let people and agents collaborate around a chart
The first is Dashboard Comments. A person can leave a question directly on a DuckLocal chart:
Why did the error rate jump during this period? Please investigate.
An agent can read the comment through the DuckLocal CLI, analyze the issue, and reply. The person can continue the discussion or resolve the thread when the question is settled. Comments live beside the dashboard in a .dash.comments.json file, so the workflow does not require a cloud collaboration service.
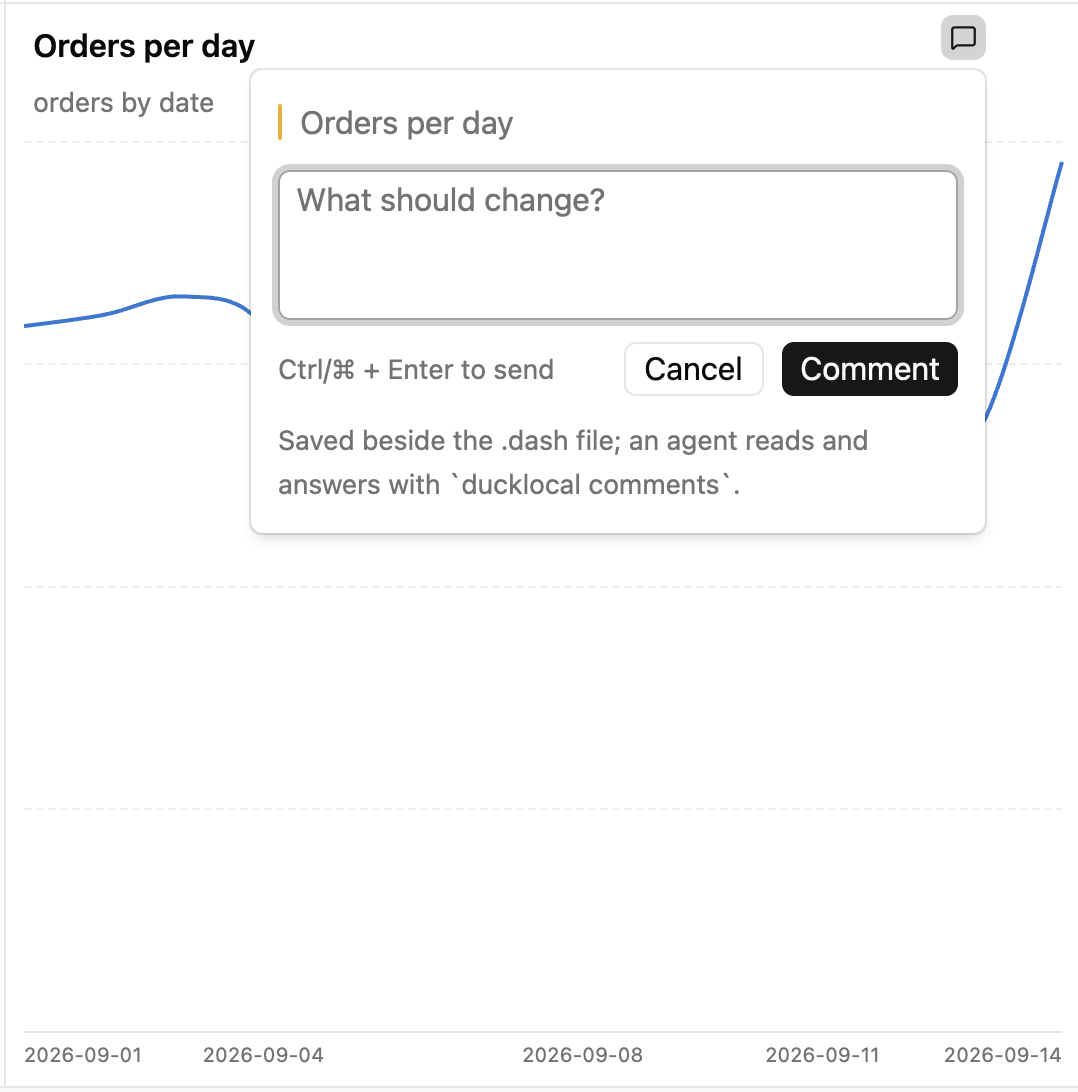
.dash file, where an agent can read and answer it with ducklocal comments.The model I want to establish is:
The person asks questions and makes judgments. The agent executes the analysis. The dashboard is their shared context.
Useful analysis rarely arrives in one pass. It emerges through questions, tests, and corrections.
Make SQL the inspectable basis of the analysis
The second capability is chart SQL inspection. DuckLocal v0.2.1 can show the last SQL actually executed for each dashboard plot, with data sources and current filter values expanded. The user can copy that SQL or open it in a query tab to modify and run it.
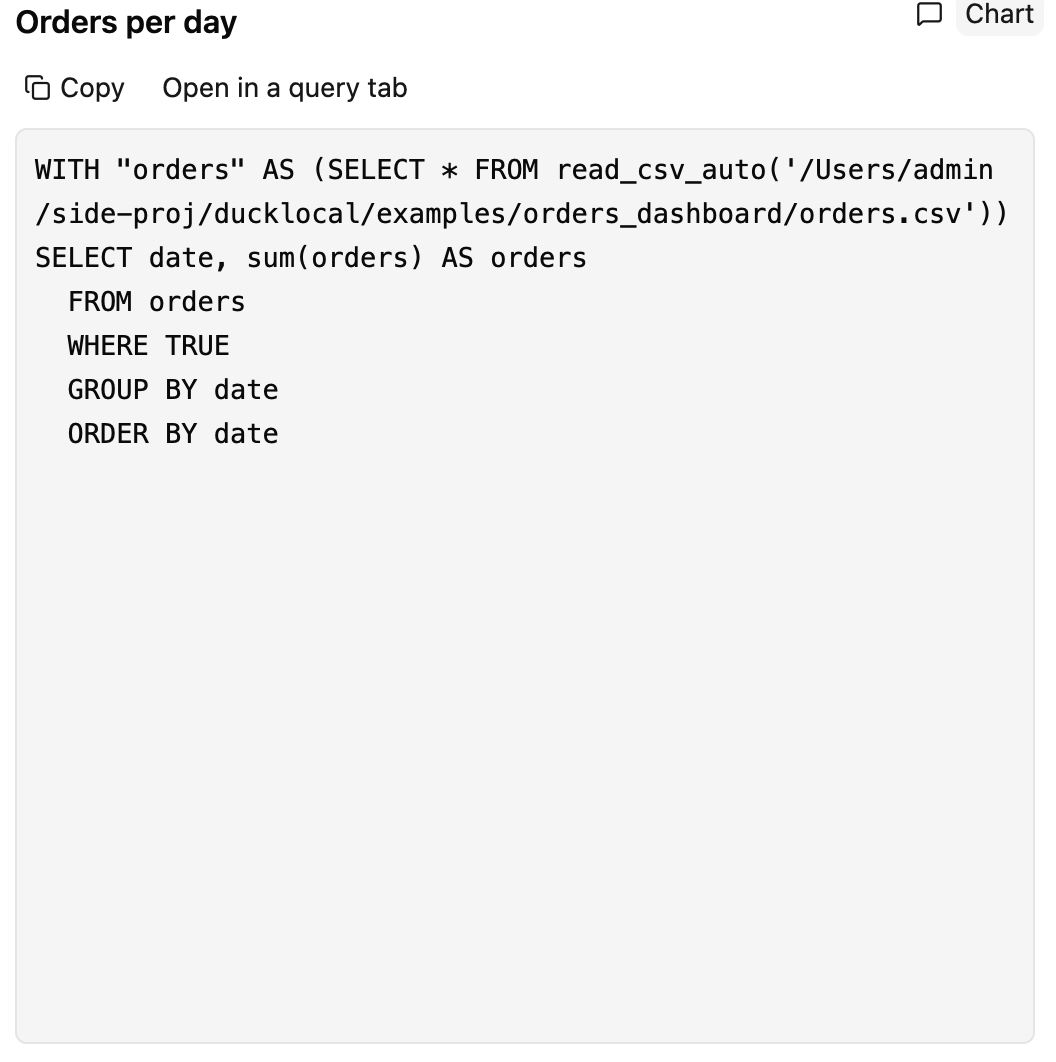
A chart generated by AI can look right while its calculation is wrong. A growth metric may use the wrong time range or omit part of the business. Showing only the final picture makes those mistakes difficult to catch.
Exposing the SQL makes the analysis more transparent. For financial, audit, and security work in particular, a result should be inspectable and reproducible, not merely easy to understand.
Related documentation: Review a dashboard with comments · Read and reply to comments from the CLI
4. How are Claude Dashboards and DuckLocal different?
Both products aim to lower the barrier to data analysis and make dashboards something people can continue exploring, inspecting, and changing. Their positioning and operating models are nevertheless different.
| Dimension | Claude Dashboards | DuckLocal |
|---|---|---|
| Positioning | AI-driven analysis and dashboards | Local-first desktop data workspace |
| Runtime | Claude cloud product | Local desktop application |
| Data access | Connectors to data platforms and business systems | Local DuckDB execution, with explicit external connections when needed |
| Dashboard model | Generated and changed through natural language | Declarative text files with CLI and agent workflows |
| AI collaboration | Primarily through a Claude conversation | Through the CLI and comments attached to plots |
| SQL transparency | View the SQL behind a chart | View, copy, and open the SQL that was actually executed |
| Source model | Closed commercial product | Open source under Apache-2.0 |
| Privacy and control | Cloud service and connector permission model | Local execution with explicit control over storage and network access |
DuckLocal does not need to compete with Claude Dashboards feature for feature. Claude's greatest strengths are the model itself and its integration with enterprise data sources and other tools. For a company already using Claude and cloud data platforms, that experience is a natural fit.
But another class of need remains: not every dataset belongs in an AI service, and not every analysis needs a cloud data platform.
Exploring a local CSV, auditing an exported financial dataset, or investigating security logs that contain sensitive information may call for nothing more than a local analysis environment. DuckLocal is local-first so those jobs can happen on the user's own device.
Local software does not automatically satisfy every compliance requirement. It does give users more direct control over where data is stored, where queries run, and when the network is used.
Privacy has to be product behavior, not a README promise
In v0.2.1, I changed how DuckDB extensions are installed. Some SQL previously could trigger DuckDB to download an extension from the network automatically. DuckLocal no longer does that by default; the user has to install an extension deliberately from the Extensions page. Automatic update checks are also off by default.
For a local-first product, privacy cannot stop at a line in the README. It must show up in the defaults.
Open source is another important distinction. Users can inspect the code and the data-handling logic, then modify the product for their own requirements. For work with demanding privacy and security constraints, that inspectability and control can become a lasting advantage.
5. Next: make the dashboard a real human-agent workspace
DuckLocal dashboards now have declarative configuration, SQL queries, visualizations, and plot comments. They are still some distance from the human-agent analysis environment I have in mind.
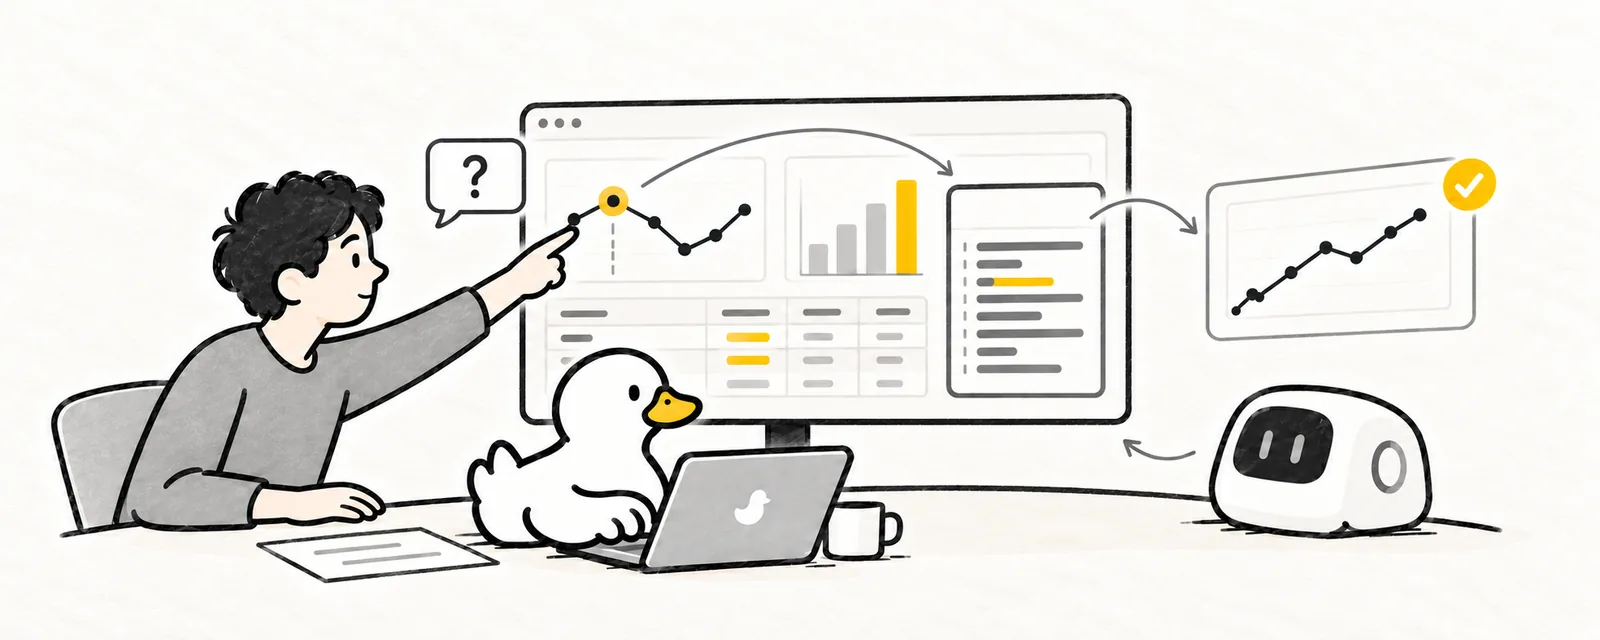
My next priority is not adding as many chart types as possible. It is connecting the steps of the analysis:
- A person asks a question on a chart; the agent understands the chart's data and SQL and continues the investigation.
- The agent does more than reply: it proposes dashboard changes based on what it found.
- The person inspects the SQL, reasoning, and changes before deciding whether to accept them.
- The dashboard records not only the final result, but also the questions, findings, and decisions that produced it.
I want DuckLocal to become more than a DuckDB GUI and more than a BI tool: a local data workspace where people and AI agents can keep working together around the same data.
6. Closing thoughts
Claude Dashboards points toward a deeper convergence of natural language, SQL, and data visualization.
AI-generated dashboards are the first step. Sustained collaboration between people and AI around data is the more interesting problem.
Claude is expanding from AI assistant toward data analysis workspace. DuckLocal starts from the other direction—a local data tool gradually adding agent collaboration. Their origins and paths differ, but they are approaching some of the same questions.
I want DuckLocal to remain grounded in three principles:
Local-firstOpen SourceHuman-Agent Collaboration
Users should control their data. The analysis should be transparent. AI should collaborate with the person analyzing the data, not become a black box they cannot inspect. That is why I continue building DuckLocal.